1. Transport Performance: A Definition
Transport Performance (TP) is a metric originally developed by the European Commission in their 2020 work on low carbon urban transport accessibility. TP puts the population at the centre of its definition, by measuring how efficiently a transport network moves the surrounding population to a destination within a certain time frame. A TP value of 100% would mean all the nearby population can travel to a location within the time threshold.
Since TP is bound by a time frame, it is highly dependent on transport modalities; for example, public transit, private vehicle, cycling, and walking. The example discussed on this page considers the public transit network.
TP is also dependent on the surrounding population and the destination itself, making it highly variable across an area. For this reason, it is calculated on a granular scale to build up the TP picture across an area of interest. The example discussed on this page uses populated 200x200m cells.
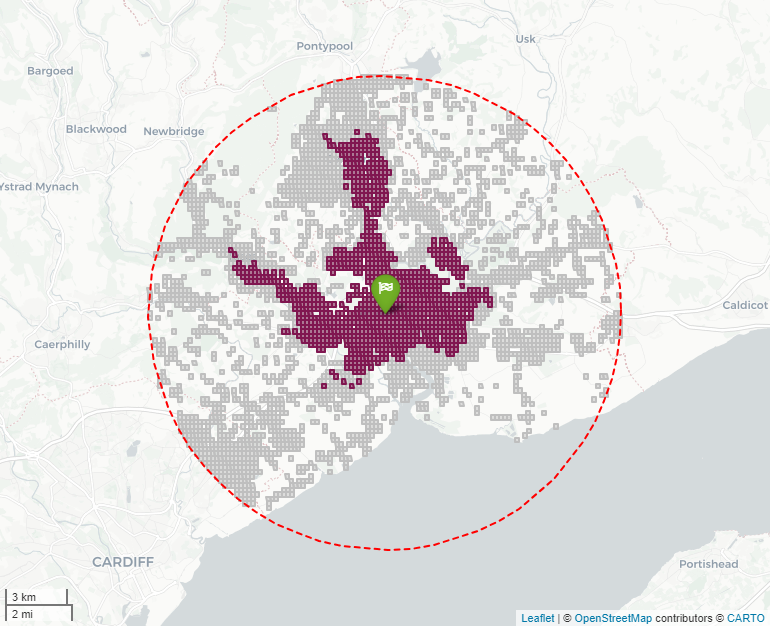
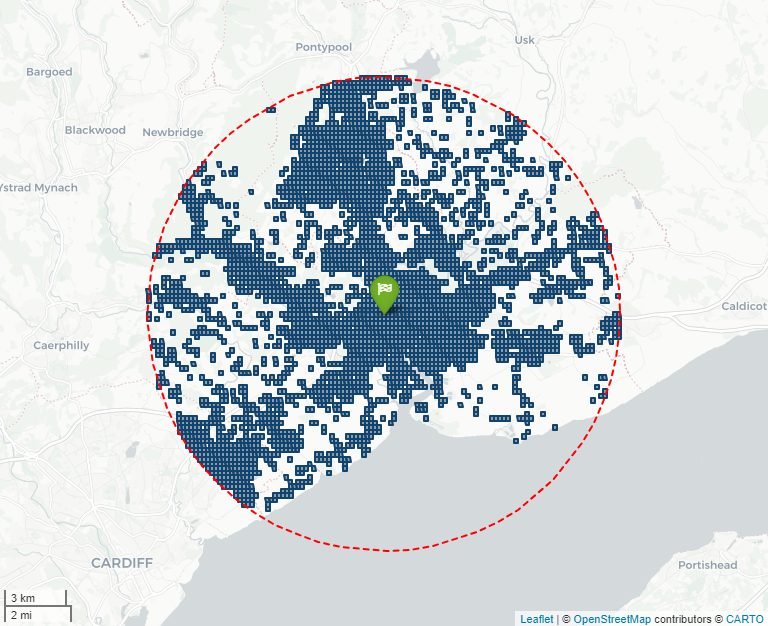
Figure 1 illustrates how TP is calculated for one cell in the centre of Newport, Wales using a 45 minutes time threshold, an 11.25Km distance limit on the surrounding population, and the public transit network.
transport_performance is highly configurable. It caters for different modalities and time/distance thresholds (and more!) beyond the configuration presented on this page. See the tutorials and API reference for more details.
Source: ONS Data Science Campus, April 2024.
Figure 1 uses a green marker to denote the destination cell and a red dashed line to illustrate the boundary of the nearby population. The dark pink region in Figure 1 (a) represents the accessible population. This is the total population that can reach the green marker within the time threshold using the transport network. The dark blue region in Figure 1 (b) represents the proximity population. This is the total nearby population within the distance limit. Then, to calculate the total accessible and proximity populations, we count the population across all highlighted cells respectively. The transport performance of the network when travelling to the destination is then the ratio of the accessible and proximity populations (multiplied by 100 to convert to a percentage), as shown in Equation 1:
\[ T_i(t_{max}, d_{max}) = 100 \times \frac{P_{access, i}}{P_{proxi, i}} \tag{1}\]
Where:
- \(T_i\) is the transport performance of destination cell, \(i\).
- \(t_{max}\) is the maximum time threshold.
- \(d_{max}\) is the maximum distance threshold (the limit on proximity population from the destination).
- \(P_{access, i}\) is the total population that can travel to destination cell, \(i\), within \(t_{max}\) and \(d_{max}\).
- \(P_{proxi, i}\) is the total population within \(d_{max}\) of destination cell, \(i\).
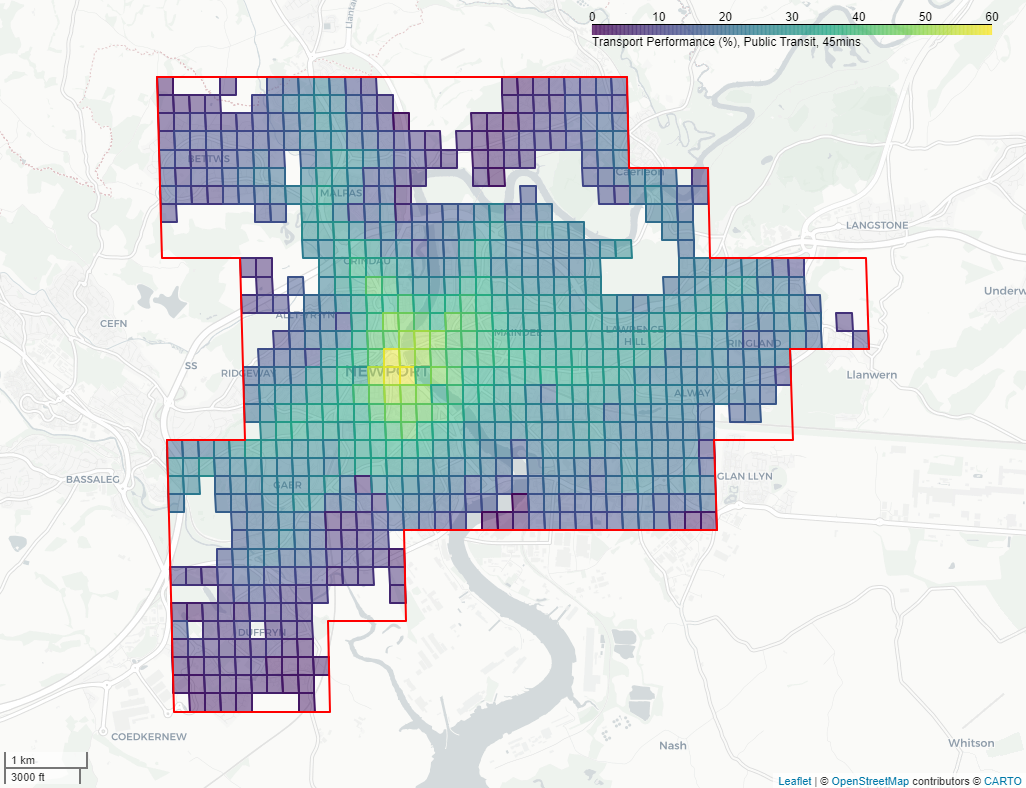
This calculation is repeated to construct the transport performance throughout an entire area of interest (in this case across every destination cell within the urban centre). An example of this for the Newport, Wales urban centre is shown in Figure 2.
Source: ONS Data Science Campus, April 2024.
Figure 2 shows how transport performance can vary across an area on a granular scale. The yellow/light green region indicates that ~50-60% of the surrounding population can reach the main city centre of Newport, Wales using public transit within 45 minutes. The transport performance also generally decreases closer to the outskirts of the urban centre. This means a smaller proportion of the surrounding population can reach the dark blue/purple areas using public transit within 45 minutes. Overall, it provides detailed, hyperlocal, insights into how the performance of the transport networks varies throughout an area.
Calculating transport performance requires several stages of input data processing and transport network travel time estimation. The methods and tools used by this Python package are discussed in more detail on the Transport Performance: An Overview page. For more insights on how to use transport_performance itself, check out the tutorials and API reference.