Google Data Studio makes it easy to pull data from Big Query and display it as a simple visualisation, but sometimes it is not clear exactly what data you need until you are looking at a report. In those situations, a custom query can be built with parameters that allow for pre-filtering, on-the-fly calculations and even introducing an offset to your time series data so that you can compare two traces at a glance. Custom queries are written in SQL within Data Studio, to select, join, filter and perform other transformations on data across any number of tables in Big Query.
We make use of custom queries for a lot of our work using Data Studio in the Data Science Campus, in order to compare several time series data sets quickly. To demonstrate the use of custom queries we shall explore COVID-19 open data from the UK Governments Coronavirus Dashboard. For the demonstration we will display the number of new cases (people with a positive test result) alongside the number of deaths within 28 days of a positive test, for each day in the first two weeks of 2021.
Disclaimer: this is a cut of official data and our use here as part of the Office for National Statistics is purely for visualisation purposes and not to comment on the data or trends.
Two challenges to overcome when visually comparing time series data is that noise can obscure trends, and that the data can be on vastly different scales (such as COVID-19 cases and deaths). To overcome these challenges, we used Boolean parameters in our custom query. For the user, choosing a value for a Boolean parameter is as simple as checking a box, but behind the scenes this introduces branching logic to the SQL query that allows calculations to be performed on demand – in this case, smoothing (calculating a seven-day moving average), and min-max normalisation as shown in Figure 1.
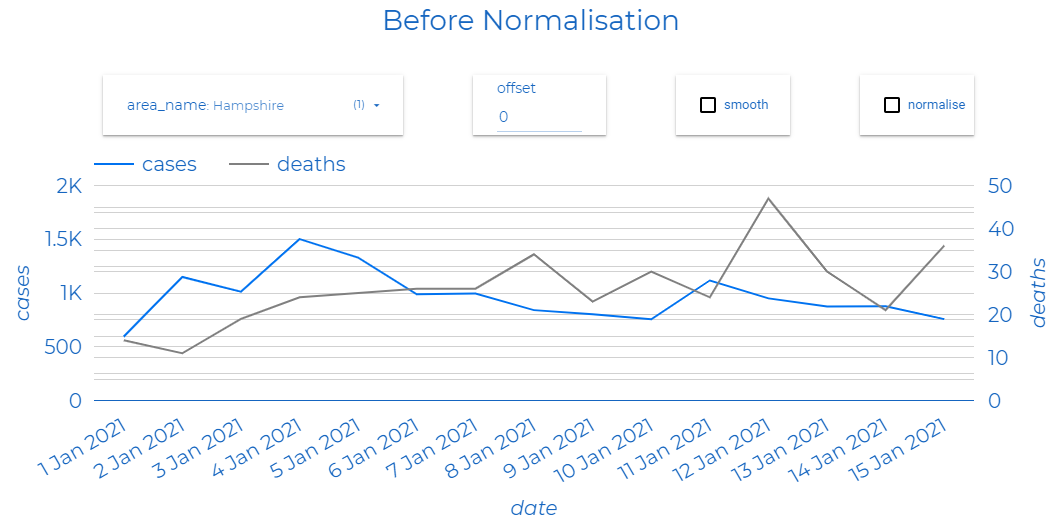
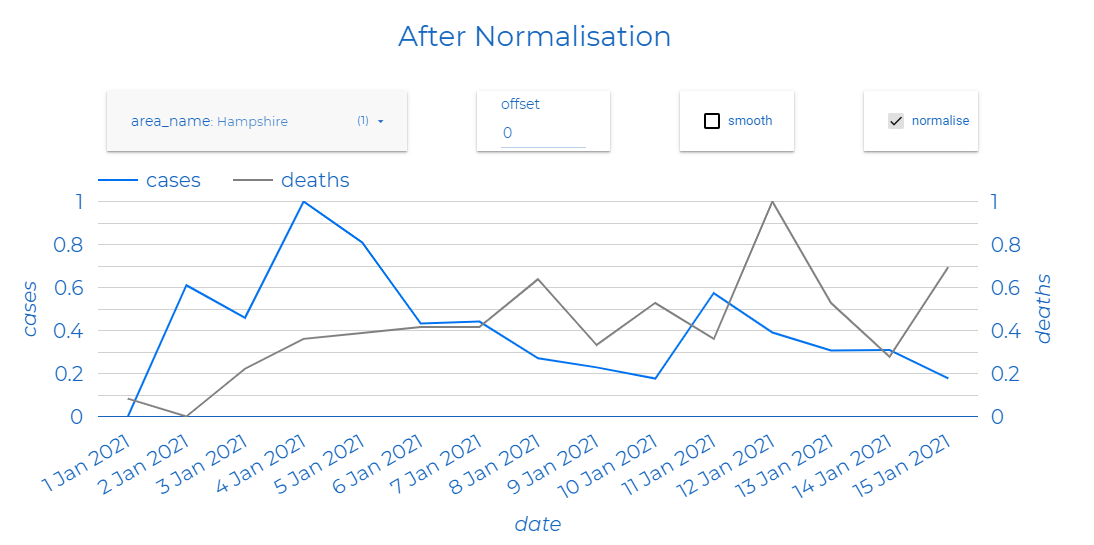 Figure 1: Time series before and after min-max normalisation is applied using the tick box. The data in the above figures is for Hampshire in the first two weeks of 2021. Source: Government Coronavirus Dashboard
The idea of this dashboard page was to provide a tool to quickly explore two or more time series data sets. To allow this, we introduced an offset parameter to the custom query. The user selects any integer and the time series in question is “shifted” by that many days, as shown in Figure 2. If there is a similarity between the two data sets being observed, this offset capability makes it easy to find visually. This process highlights data sets that should be explored and compared more closely.
We used this process for different data sets, but for the purposes of demonstration you can see it below for the open COVID-19 data.
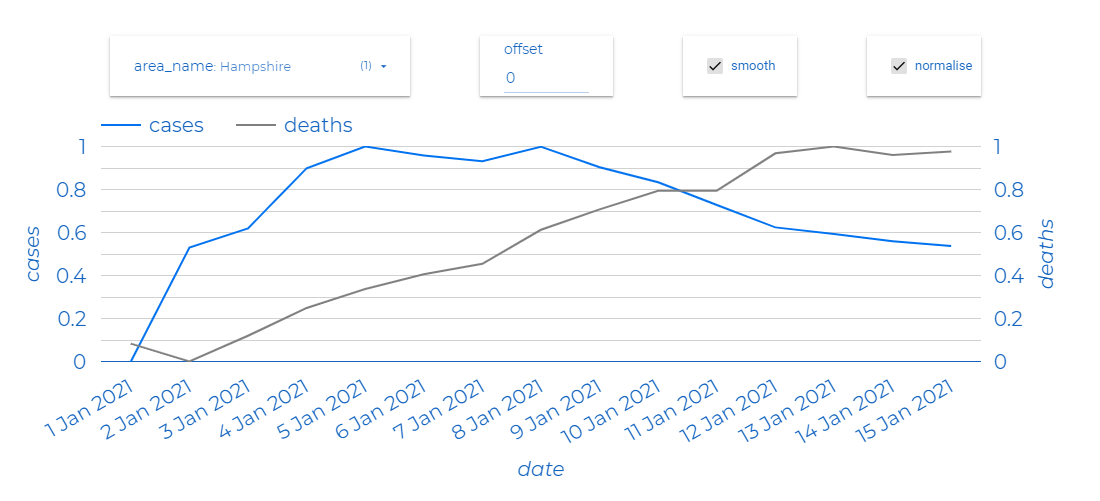
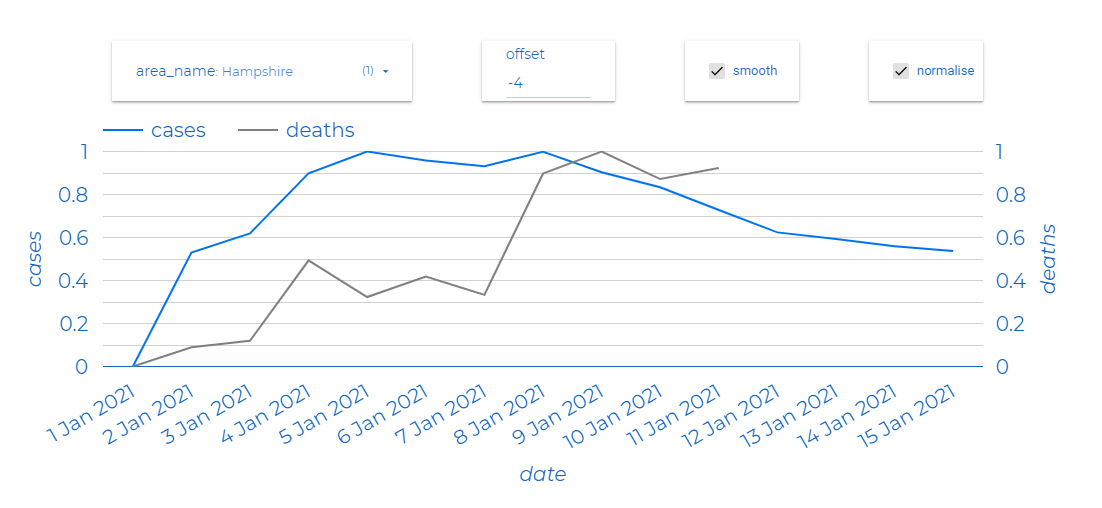 Figure 2: Introducing an offset allows the user to visually inspect two time series in search of patterns. In the second image, the deaths series has been shifted by four days. The data in the above figures is for Hampshire in the first two weeks of 2021. Source: Government Coronavirus Dashboard
How to use custom queries to connect to BigQuery
From Data Studio, in edit mode, select Resource > Manage Added Data Sources and + Add a data source. Select BigQuery as your source, and on the left-hand side of the screen select CUSTOM QUERY. From here, select the project you want to connect to and you will be presented with a custom query input box as well as the Add Parameter button.
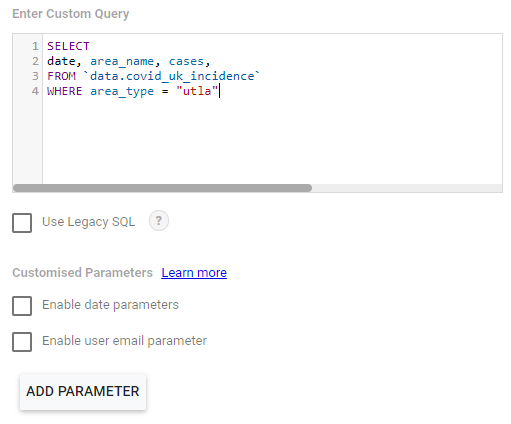 Figure 3: Creating a custom query within Google Data Studio
The parameters you create can be Boolean, string, or numeric, and you can either choose to allow any value as input (as we did for offset) or limit input to pre-defined options.
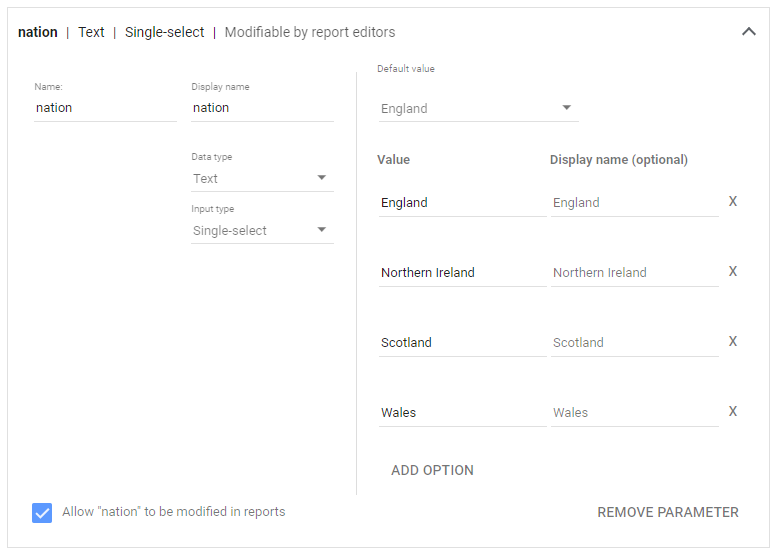 Figure 4: Creating a parameter for a custom query. This is a string parameter that is limited to take on only four values, the UK nations.
To incorporate your parameter into your query, simply type @[parameter name], as shown below:
SELECT
date,
area_name,
cases
FROM `data.covid_uk_incidence`
-- filter by nation
WHERE area_name = @nation
To introduce branching logic with Boolean parameters, you would use a CASE statement:
SELECT
date,
area_name,
CASE @smooth
  	WHEN false THEN cases
  	WHEN true THEN
  		AVG(cases) OVER (
        	PARTITION BY (area_name)
        	ORDER BY date
        	ROWS BETWEEN 6 PRECEDING AND CURRENT ROW)
  END AS cases,
FROM `data.covid_uk_incidence`
WHERE area_name = @nation
And to introduce an offset to time series data, create a parameter of type Number(whole) and insert it into a DATE_ADD function in your query.
SELECT
DATE_ADD(date, INTERVAL @offset DAY) AS date,
area_name,
CASE @smooth
  	WHEN false THEN cases
  	WHEN true THEN
  		AVG(cases) OVER (
        	PARTITION BY (area_name)
        	ORDER BY date
        	ROWS BETWEEN 6 PRECEDING AND CURRENT ROW)
  END AS cases,
FROM `data.covid_uk_incidence`
WHERE area_name = @nation
There are many other ways to make use of parameters in custom queries. For example, using a parameter to filter data (as shown above) prevents data studio from loading an entire dataset only to filter it again afterwards.
To find out more about using custom queries with parameters, take a look at Data Studio’s documentation. You can also explore the report described in this post.