Between January and April 2019, I had the incredible opportunity to take part in the ONS Data Science Mentoring Scheme. At the time of starting the scheme, I had been working at Ordnance Survey as a Graduate Data Scientist for just over a year, and although I had a learned a lot in that year, I still felt very fresh to Data Science. To take part in the scheme, you have to apply with Data Science-related project that has a real business need, making sure that not only are you learning the essential skills needed to be a Data Scientist, but your work is also meaningful to your organisation. You are assigned two experienced Data Scientists as mentors, with whom you work for one day a week over a 12-week period. Whilst your mentors are always on hand and ready to help, they also make sure that you take ownership over your own project and workflow. This really made the whole scheme an ideal environment to accelerate my skills in python coding and increasing my knowledge on machine learning. In this blog, I will summarise the project, by explaining the OS data-related problem we were trying to solve, giving a brief overview of the methodology we used and provide sneak peak at some of our promising initial results, thanks to which, I am now carrying the work forward post-mentorship and continuing to explore what else can be discovered and how the machine learning model we built can be improved.
The Project: Feature Extraction: Using OS Data and CNNs to detect Caravans in Imagery
Problem
The data requirements of OS customers are always changing and ever-increasing. One request that has come up time and time again is a more detailed and comprehensive coverage of static residential and holiday caravans. This information is important for use cases, such as the ONS census work or for the Emergency Services, who need an accurate and up to date dataset of every residence in the country.
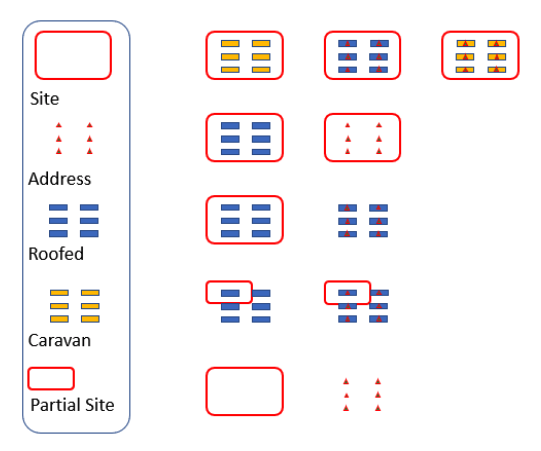
Unfortunately, OS do not have a full comprehensive recording of where all the caravans and caravan sites in Great Britain are. Although, separate classes for both caravans and caravan sites have recently been added to our specifications for surveyors to capture, many caravans still haven’t been captured or have been captured as a ‘roofed structure’. Diagram 1 explains the current state of our data on caravans well. Ideally, we would like to have the example in the top right-hand corner, i.e. all caravans are captured as caravans, there is an address point in each caravan, and the caravan site encompasses all caravans on the site. Unfortunately, this is a rare occurrence, and there is a combination of every other possibility shown in the diagram in our core database. As such, our problem can be boiled down to two questions:
- Where are static caravans located?
- Where are static caravan sites located?
By answering the first question, we help inform the second question, so this project focused on answering this first question by finding individual caravan polygons in imagery through Object Detection using Convolution Neural Networks.
Methodology
After a lot of research on possible CNN models we could use for object detection, including YOLO, SSD, various versions of R-CNN, we decided on the latest version of R-CNN, Mask R-CNN.
Mask R-CNN does not only do classification and bounding-box object detection but also does image segmentation. It was the winner of the Marr Prize at the ICCV in 2017 and He et al. (2017) claims that “without bells and whistles, Mask R-CNN outperforms all existing, single-model entries on every task, including the COCO 2016 challenge winners”.
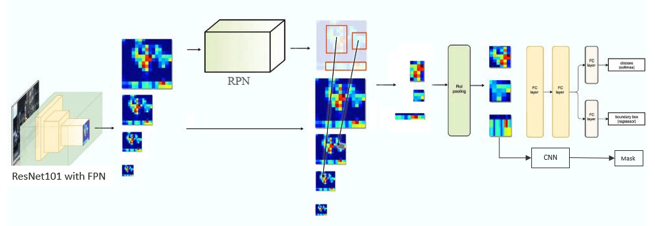
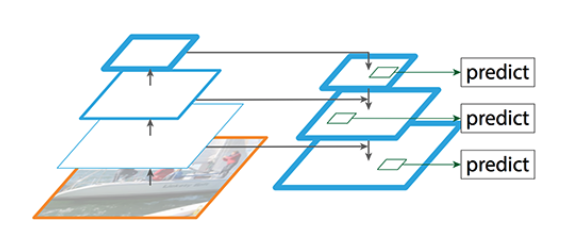
It is built in python 3 using Keras and Tensorflow and its infrastructure can be seen in Diagram 2. At the backend it has a ResNet101 incorporated into a Feature Pyramid Network (FPN). The FPN tries to solve the problem of losing locational accuracy of an object in an image, as the image goes deeper into the CNN, thus being more and more abstracted. Previously, this has been solved by using the same image at different scales (i.e. a pyramid of multi-scale images) as input for the CNN, but this is extremely computationally expensive. By using a bottom-up/top-down infrastructure, an FPN can create multi-scale feature maps instead, meaning that the same scale for all input images can be used. Diagram 3 shows this bottom-up/top-down structure. The bottom up is your normal Feature Extractor CNN, in our case ResNet101. As an image passes through this network, it is downsampled, thereby gaining in semantic value but losing resolution. So, in the top-down pathway, the output from ResNet101 is upsampled and information is added from higher resolution layers in the bottom-up pathway to semantically rich layers in the top-down pathway. This eventually outputs multi-scale feature maps. These feature maps then go through a Regions Proposal Network (RPN), which is a CNN that proposes Regions of Interest (ROI), i.e. regions or bounding boxes on an image which is likely to contain an object of interest, a caravan in our case. It does this by using a pre-determined set of fixed anchors, or bounding boxes, and ‘asks’ does this anchor contain a relevant object and how would we adjust this anchor to better fit the relevant object? It does not, however, do any classification. This happens later in the model. The individual proposed regions first go through an ROI pooling layer, and the outputs then go down further three different paths, a Classifier and a Bounding Box Regressor, each using Fully Connected layers and finally a separate CNN to create the Image Segmentation masks. It is these masks that we were interested in for this project, as we only had one class anyway and need better precision than a simple bounding box, so the pixel by pixel classification in the image segmentation suited best.
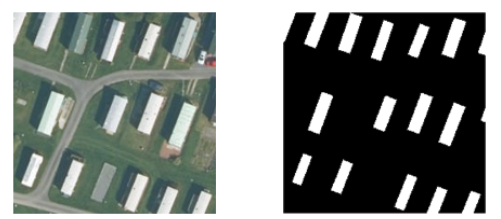
The model requires square raw images and corresponding labelled masks as input for training. As such, we used a dataset of roughly 17,500 caravans across GB that have been correctly surveyed as caravans. Their locations were cross-referenced with OS imagery tiles. Then 224*224 image patches centred on individual caravans were cut out using the Rasterio and Geopandas python libraries. Their corresponding masks were created using the caravan geometries and image patches with the Rasterio and Skimage python libraries (examples seen in Diagram 4). A sample size of 1000 image patches and their corresponding labels were taken and split into a training (75%), validation (15%) and a testing dataset (15%). We were also able to make use of Transfer Learning by using the pretrained Mask R-CNN model and MS COCO weights instead of training it from scratch. This worked very well, and the results will be discussed in the next section.
Results
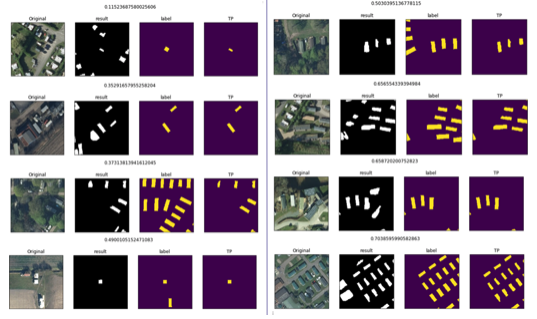
The model was trained to only classify caravans which had a 90% certainty. Diagram 5-6 show the top 8 best and worst results respectively. F1 scores, the weighted average of precision and recall, were calculated to assess the model’s overall accuracy. The Average F1 score was 0.84, with the highest score being 0.96 and the lowest being 0.12. In some cases, tree cover made classification impossible. In other cases, the model was still confused about the difference between other buildings and actual caravans.
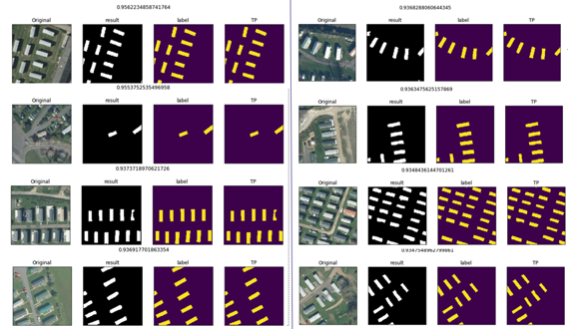
In most cases however, the model actually did better than the labels, and this is because the caravans weren’t hand labelled but taken from the OS core database, which is of course incomplete, and the reason this project went ahead in the first place. This affected the F1 scores somewhat, and it is estimated that they should actually be higher. Nonetheless, the model did very well for a first iteration and shows potential to be further improved, which brings me to how this project is being taken forward post Data Science Mentoring Scheme.
As I mentioned, the fantastic initial results of the project show real potential for continued model development and to use it to find not only individual caravans but also to eventually answer the second question that I stated in ‘The Problem’ section up above, “Where are caravan sites located?” These can then in turn be checked and surveyed by our surveyors, thereby speeding up the current estimated 3-year cyclic revision for full GB updates. Firstly, the model’s accuracy will be improved by improving the labelling, i.e. using hand labelling on a collection of image patches. Furthermore, more datasets particularly ones in found in urban areas need to be tested to increase reliability of the model and train it to differentiate between other buildings and caravans. Some pre- and postprocessing in OpenCV such as using a rectangle detector can also improve the outputs. And finally, perhaps most interestingly, I will investigate and carry out different clustering methods, which can be used on the model’s results in order to find clusters of caravans, which would indicate a caravan site.
Final words
To finish, I just wanted to give another thank you to everyone that provided input and helped out with the project both at OS and at ONS, and a particular special thank you goes to my mentors Dan Lewis and Arturas Eidukas. I really cannot stress enough how beneficial the Data Science Accelerator Programme was for me, and hope this encourages anyone reading this and thinking of applying to take the plunge into a truly challenging but rewarding experience.
Code
Links
- More information on the accelerator programe: Introduction to the Data Science Accelerator programme
- Related work: ONS methodology working paper series number 15 – Feasibility study: Caravan parks recognition in aerial imagery